COLLINALITICSAnalytics Consulting
Home
Contact
Book a free review
Home
Contact
Book review

Ready to start?

Replace your manual reporting with something that actually works.

Book a free 30-minute data review. No obligation. We look at your current setup and give you a plain-English recommendation before any work begins.

Book a free reviewSee example work
Collinalitics LtdAnalytics Consulting

Power BI dashboards, SQL data modelling, Tableau visualisation, and reporting automation for UK SMEs that need clear, trusted analytics.

+44 7939 535 361info@collinalitics.co.ukChat on WhatsApp →

Explore

  • Home
  • Services
  • Work
  • Pricing
  • Blog
  • About

Company

  • Contact
  • Careers
  • Assistant
  • Meet the founder
Registered in ScotlandCompany No: SC874504Edinburgh, Scotland

Legal

  • Privacy policy
  • Cookie policy
  • Terms of service

© 2026 Collinalitics Ltd. All rights reserved. Registered in Scotland · Company No: SC874504

Power BITableauSQLEdinburgh-basedSME specialistsFixed price
Sales dashboard — overview
Work·Retail · E-commerce

Sales Performance Dashboard

“From a 4-hour Monday spreadsheet rebuild to a live revenue view leadership could act on immediately.”

Power BIExcelCSV

Sector

Retail · E-commerce

Client

Online retail SME · Scotland

Timeline

3-week build

Tools used

Power BI · Excel · CSV
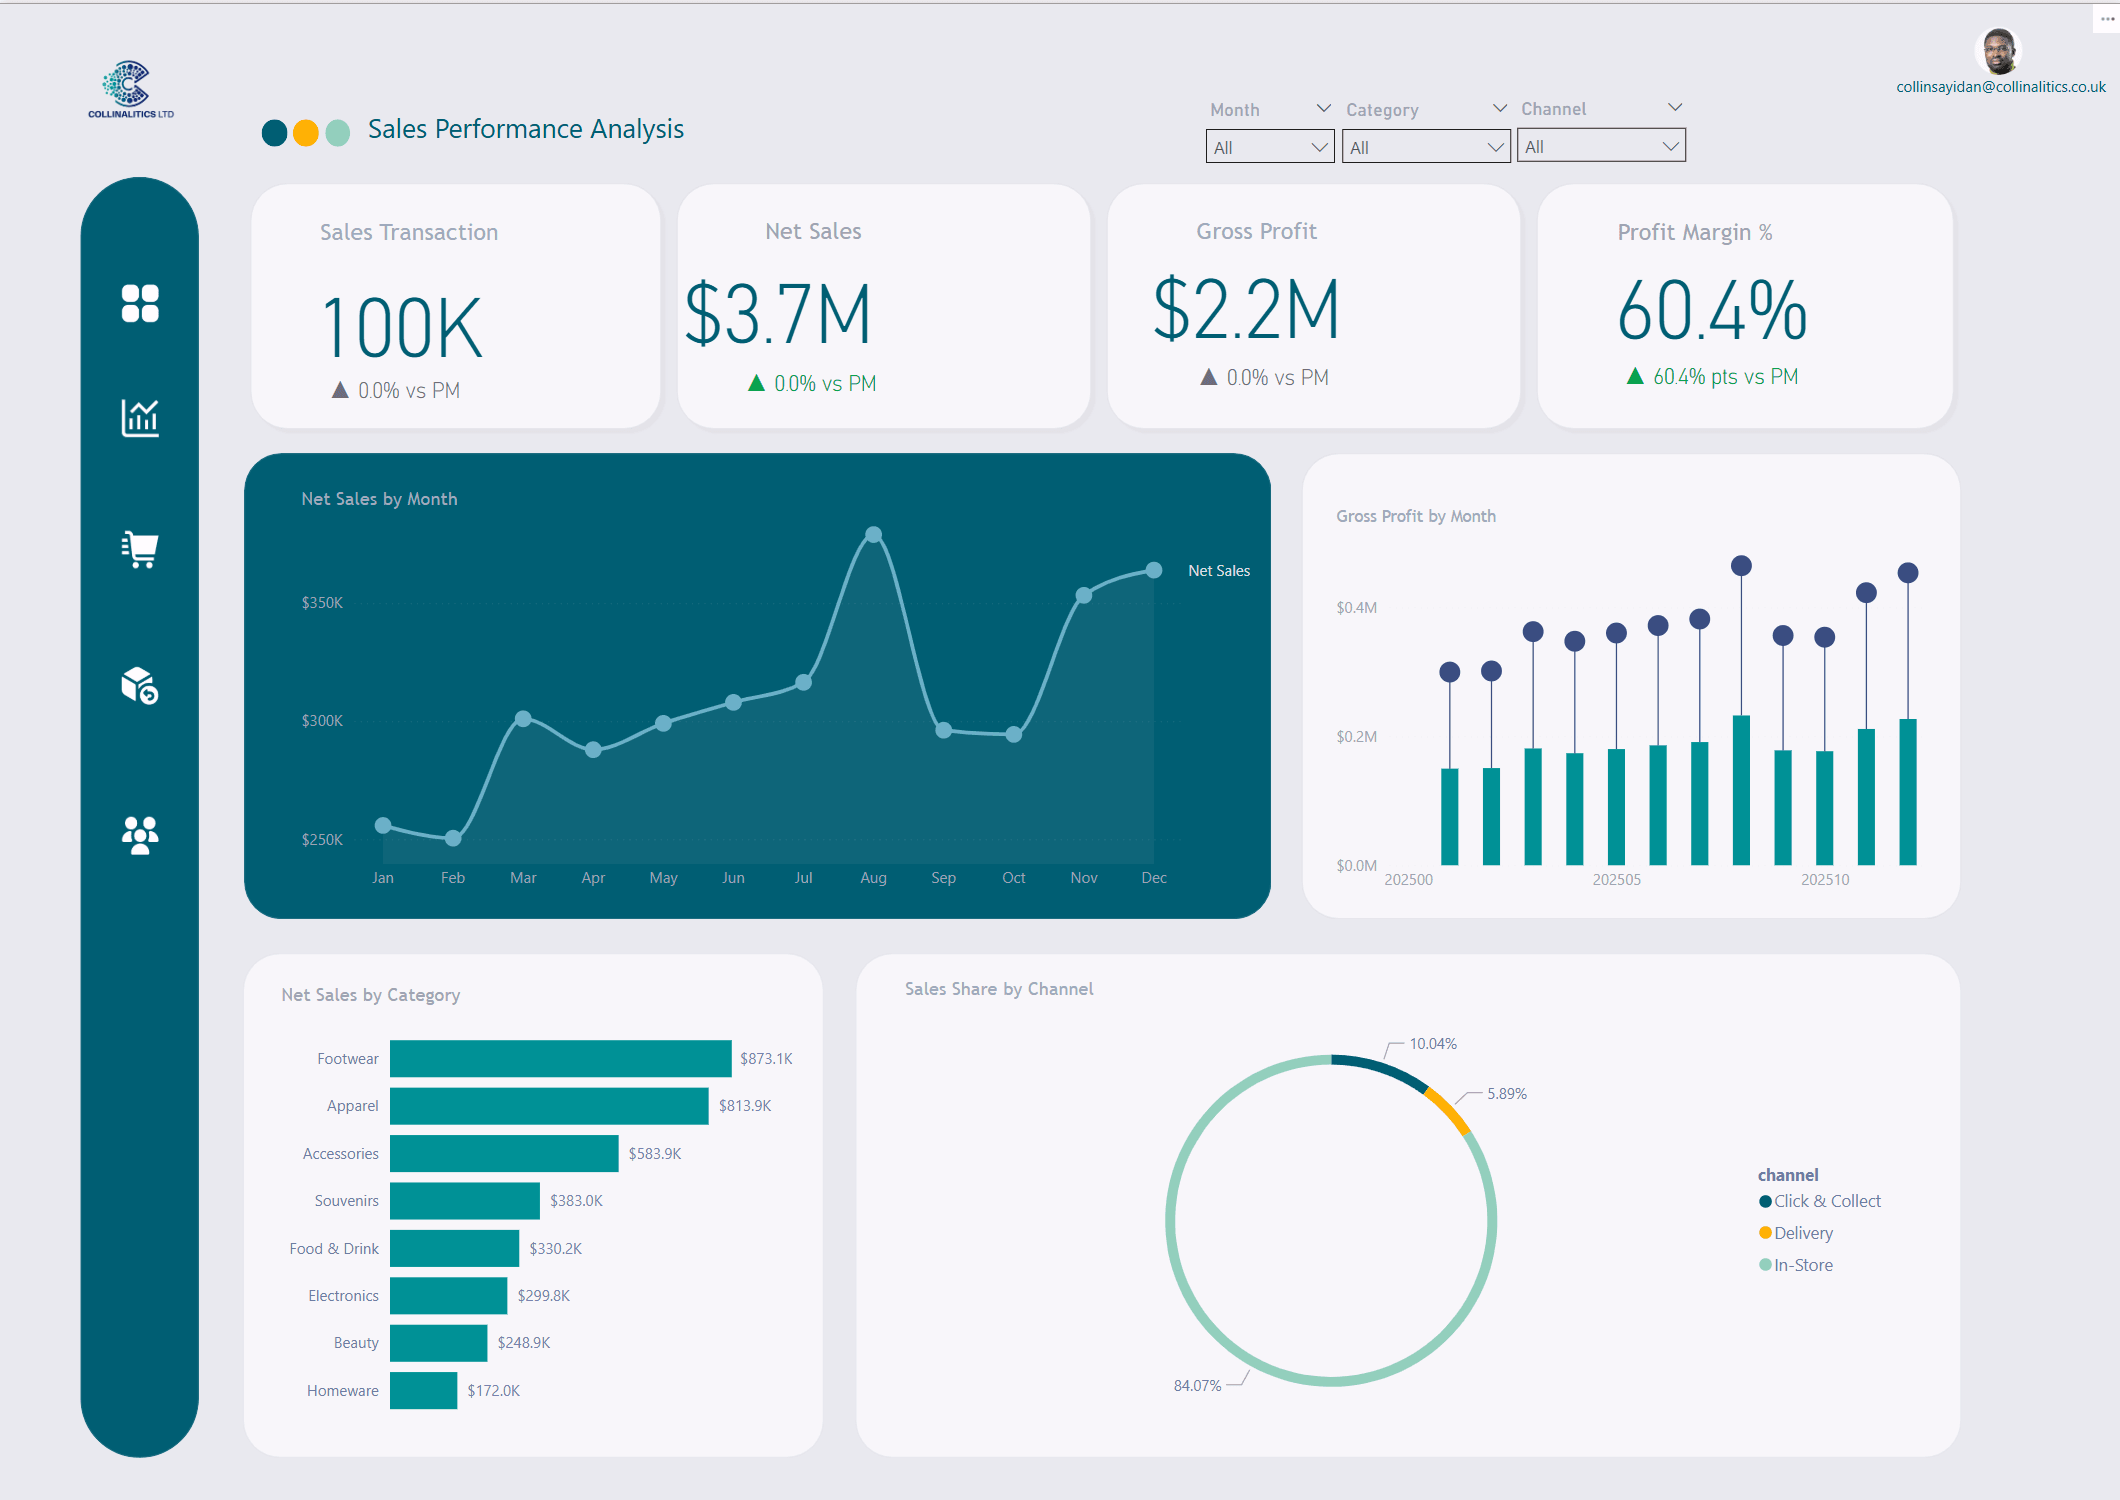
4–5 hrsSaved per week
3Sources consolidated
6Core KPIs agreed

The challenge

Every Monday morning, someone spent four hours pulling together sales data from three separate spreadsheet exports. By the time the report was ready, the week had already started — and the numbers were already out of date.

The approach

We agreed six KPIs with leadership, standardised the three data sources into a clean Power BI model, and built a single-page dashboard that refreshes automatically when the source files are updated.

The outcome

Monthly reporting reduced from a half-day task to a dashboard refresh. Leadership gained clear product and category visibility for the first time — and identified a seasonal pattern they had not previously tracked.

KPIs in the dashboard

RevenueOrdersAvg Order ValueMoM GrowthTop ProductsCategory Split

Tools used

Power BIExcelCSV

Anonymised engagement — client details generalised.
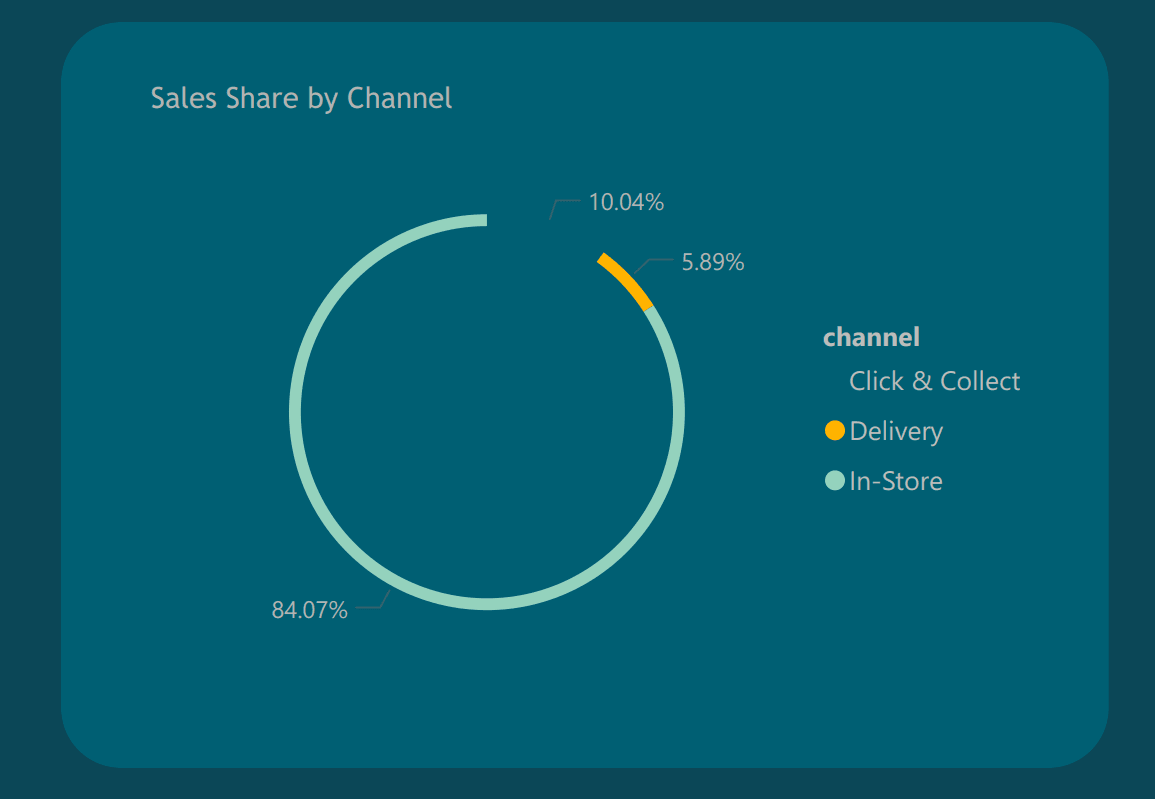
Dashboard views

Inside the dashboard.

Each view was designed around a specific reporting question — not just a default chart layout.

Sales dashboard — top products
Top products by revenue and volume
Sales dashboard — category split
Category split with trend lines
Back to all work

Want a dashboard like this for your team?

Book a free data review — we'll look at your current reporting, agree the KPIs that matter, and give you a clear scope and price before any work begins.

Book a free data review View pricing

Next step

Ready to replace your manual reporting?

We scope every project with a free 30-minute data review — so you know exactly what you'll get and what it will cost before any work begins.

No obligation · Edinburgh-based · SME specialists

Book a free data review View all case studies